Front-end optimisation
Posted on 15 August 2014 by John Pash
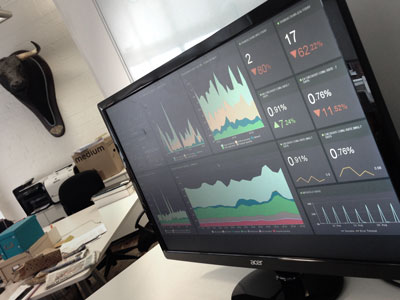
Here at Easyart we are obsessed with speed. We constantly monitor the website’s dataflow from server response time all the way through to the end user experience. In our office, within view of the developers is a dashboard which immediately alerts us to any slowdowns or performance changes on the platform. 
We take advantage of the great tools provided by New Relic and webpagetest.org and pipe them through a Geckoboard dashboard.
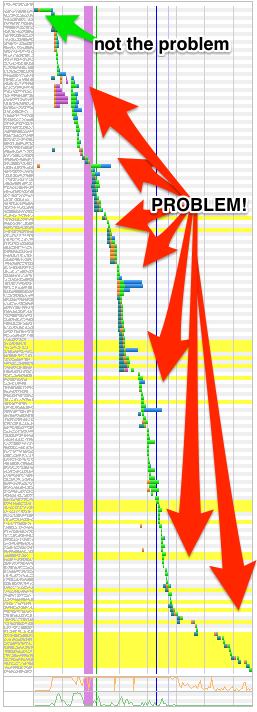
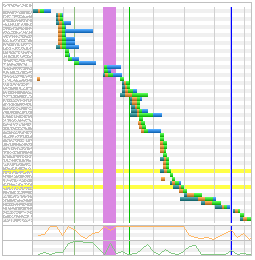
During a recent “speed-up sprint” we got stuck in to the numbers to try and find where the bottlenecks were and what we could do to fix them. So we ran a few tests on one of our product pages using various browsers in a few different locations around the world (thanks to webpagetest.org). The results showed that we should be focusing on front-end performance rather than the server/database/back-end (more on that later).

That waterfall chart certainly doesn’t look like the work of a team who “are obsessed with speed”! Not to worry, that’s the purpose of this exercise. So time to roll up our sleeves and find out just what’s going on here. We try to adhere to best-practices by gzipping content, using a CDN for assets etc. But the problem turned out to be even more simple to diagnose.
Requests!
There were a whopping 140 requests with a total download size of 1.3MB. So it was decided that reducing these would give the biggest return on investment. It turns out that many of these requests were coming from 3rd party scripts which download further scripts and tracking images. In particular, the popular addthis.com sharing button was a serious offender. This information is good to know, but we can’t just go removing things without a discussion with the marketing department first. So that will have to come later. Let’s clean up our own back yard first.
Images and lazy loading
On our target page we are loading 16 “related prints” which means 16 requests. We decided to “lazy load” them, meaning they won’t download until the user scrolls down the page. Strictly this won’t have any effect on total download size, but it will free up the user’s bandwidth and CPU for other things. Such as the Backbone app that powers this page.
Backbone and lazy coding
In the Backbone app we have a modal which displays a custom framing interface, complete with dozens of framing options. We were creating this view - and downloading the images it containted - every time the app booted. But not every visitor sees this modal, so why waste the bandwidth?
The reason for this oversight is because in a previous design, the custom framing module was on the page, seen by everyone. But later it was moved into a modal, and the code wasn’t refactored with optimisation in mind. So by now creating the view on demand (user clicks the change frame option) we save a few more image requests. Lesson learned: when things change, clean up after yourself.
Modals should only appear when requested
Further down the page is more 3rd party code (ugh) which displays a widget of recent reviews. This code downloaded even more js code, some css and even a webfont! So we changed this to download on when requested (onClick). Then we found 2 more modals of our own that were hard-coded into every page waiting for someone to find the magic link that would spring them into life. It’s easy to code, but not very efficient. These were also changed to onClick events.
Sprite-ify all the things!
 The main “mega menu” for art Themes has 12 tiny thumbnails which represent each category. A prime candidate for a sprite sheet. This one change alone would save 11 requests at the cost of a slightly larger css file. But the trade-off is worth it. But why stop with these 12? We had a look at every site asset in the header/footer and elsewhere, and started adding them to the master sprite sheet. But as you may know, jpgs tend to be suited to photographic images and pngs work better for large blocks of colour and sometimes require transparency. So we decided to have the best of both worlds and make one of each (thank you Sprite Factory). This means two sprite requests, but better optimisation of the images themselves. Not to mention the quality of the images won’t suffer as much as they would if we tried to force a jpg-type image into a png.
Results
So what were the results of all this tuning and tweaking?

Speed Improvement
| Requests | Download Size | Time | |
|---|---|---|---|
| Before | 140 | 1.3MB | 12.2s |
| After | 53 | 698kb | 3.2s |
| Diff | 62% | 46% | 74% |
Unexpected win
After the work was complete, tested and pushed to production and the victory celebration was about to start, we were alerted to the fact that Google Anlaytics wasn’t happy with the page speed! How could this be? Well the timing of this news was just a coincidence since it had nothing to do with the recent changes. What G was really complaining about was server response time. Something we blissfully ignored for this project. So back to New Relic to find the source of the problem.
What happened next could fill an entire blog post, but the long and short of it is: The amazing “Oj Gem”! Over 100ms saved on each and every JSON request from our back-end service.
